In 2016 The Alaska Ocean Observing System was awarded a National Academy of Sciences Synthesis award on the topic "Synthesizing AIS ship tracking data, GNOME oil spill model results, and subsistence use information into a unique, interactive tool to aid research and planning in coastal communities bordering the Alaska Beaufort Sea". Along with Axiom Data Science and Stephen R. Braund & Associates (SRB&A), the work was completed in November of 2018. The project integrates data products describing vessel traffic patterns and subsistence use data from the communities of Utqiagvik, Nuiqsut, and Kaktovik along the Beaufort Sea coast. These datasets were used to generate an analysis of estimated oil spill risk to these areas and they offer a unique tool for planners and subsistence community members.
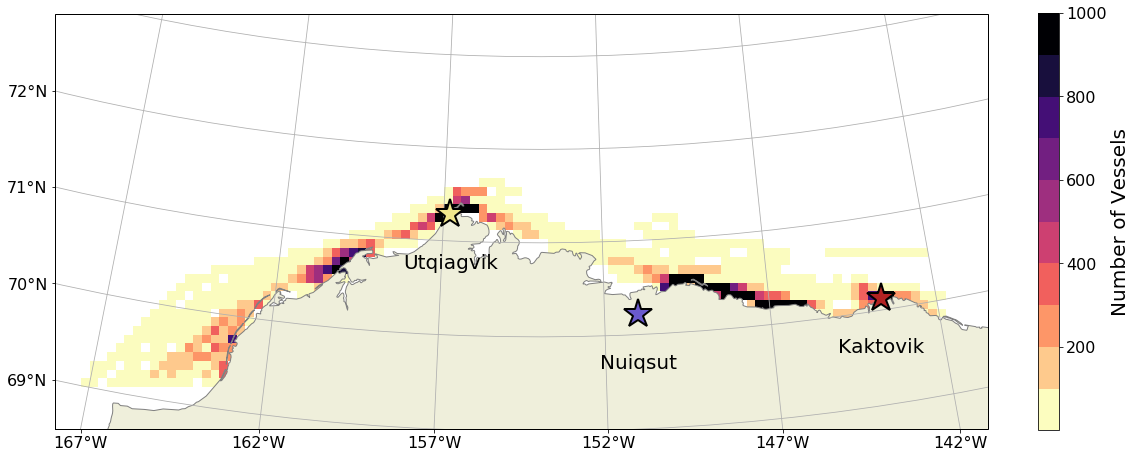
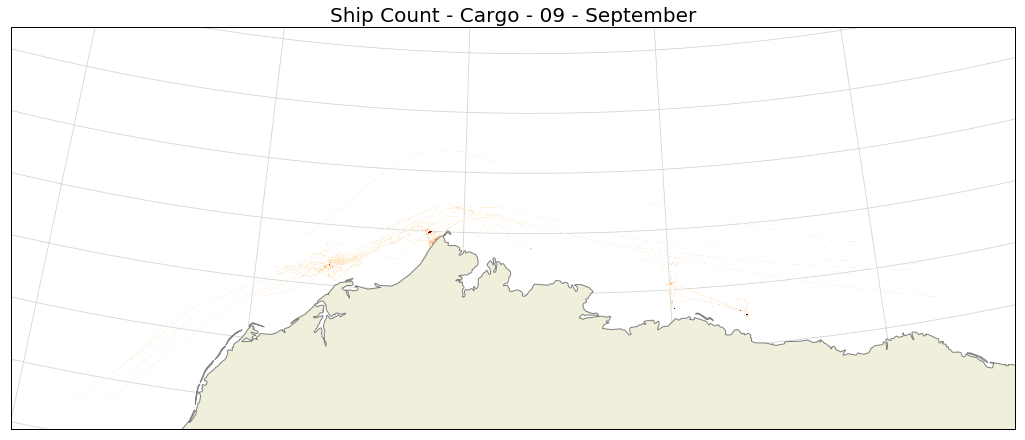
These traffic density maps were generated by Axiom Data Science using raw Automated Identification System (AIS) data from the Marine Exchange of Alaska to identify locations from which to release hypothetical oil spill simulations.
The Original AIS data products and processing methodology are described in detail on the Axiom AIS Web Portal.
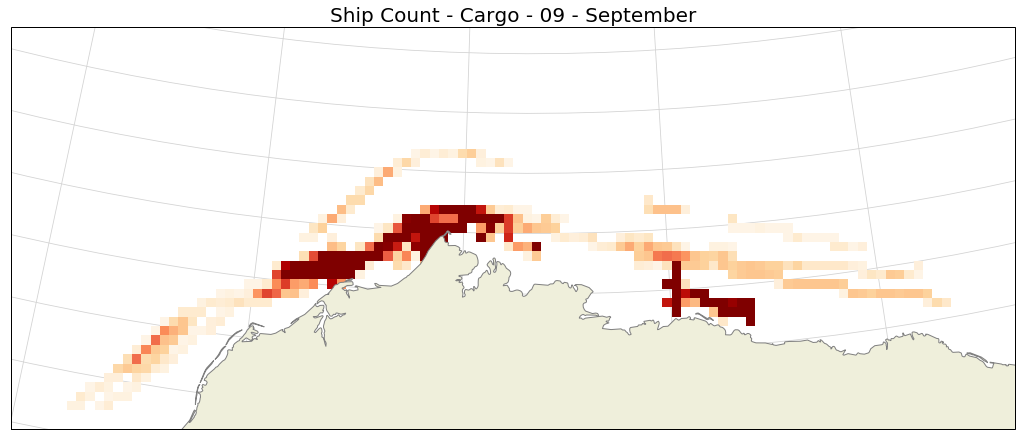
The AIS data products available here are regridded to a 10 km resolution matching the Particle Release Grid.
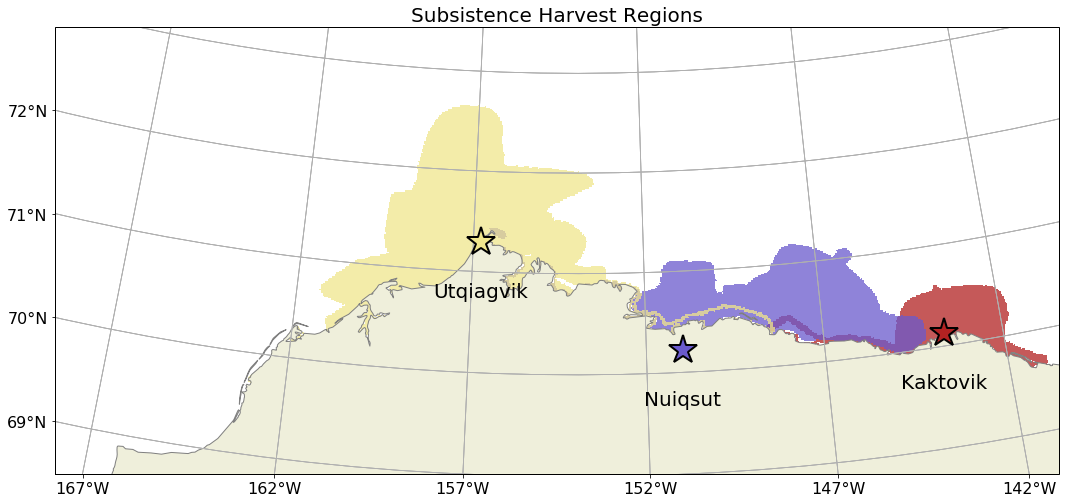
SRB&A conducted surveys on subsistence harvesting over more than a decade from the Alaska Beaufort Sea communities of Utqiagvik, Nuiqsut, and Kaktovik. They aggregated the surveys into a series of reference datasets representing harvest areas by resource and by month. These subsistence datasets have been previously unavailable to the public.
Axiom Data Science ran ~90,000 oil spill trajectory scenarios in the Beaufort Sea coastal study area. The spill model results were summarized to produce a spill impact density map and relative risk assessment for subsistence harvest areas.

The objective of this project was to bring together and publish exisiting data products that describe vessel traffic patterns and subsistence uses along the Beaufort Sea coast to inform the development of an Oil Spill Risk Assessment (OSRA) following the ISO-compliant IT-OSRA methodology ( Sepp-Neves 2015, Sepp-Neves 2016 ). This methodology was selected because it incorporates the likelihood of a vessel being present in a given location (AIS data) and social value for a region (subsistence-use data) with results from oil spill simulations to derive a risk assessment.
The hypothetical oil spill simulations were released throughout the Beaufort based on historical AIS data.
The IT-OSRA methodology requires oil spill simulations to be released from predefined locations where vessels had previously traveled through, a Particle Release Grid.
The AIS data products originally consisted of vessel traffic density on a 500 m square grid which would have required more than a million oil spill simulations - a substantial computational task. To strike a balance between taking advantage high-resolution AIS data and computational efficiency, the AIS data was re-gridded onto a 10 km square grid.
All data in this analysis including AIS, subsistence harvesting, and the results from oil spill simulations were regridded to this 10 km grid.
Oil spills were simulated using PyGnome, the oil spill modeling tool used by the NOAA Office of Response and Restoration.
The simulations were forced by HYCOM for ocean currents, temperature, and salinity and NCEP NCAR Reanalysis for winds. Every simulation was parameterized to use 1000 particles to simulate the release of 1000 bbl of marine diesel subject to weathering via evaporation, dispersion, and emulsification. Simulations were run for a period of one week.
The location and release time of oils spill simulations were determined by AIS data. Vessels types were grouped into 10 archtypes which were then used to seed oil spills and organize analysis. For each archtype, a simulated oil spill was released from each point, $r$, in the Particle Release Grid where a vessel was present. Oil spill simulations were started on a weekly basis for every month that vessels were present to capture the variability in oceanic and atmospheric conditions.

The calculation of the risk associated with oil spills combined the AIS data, subsistence use data, and the results from the oil spill simulations.
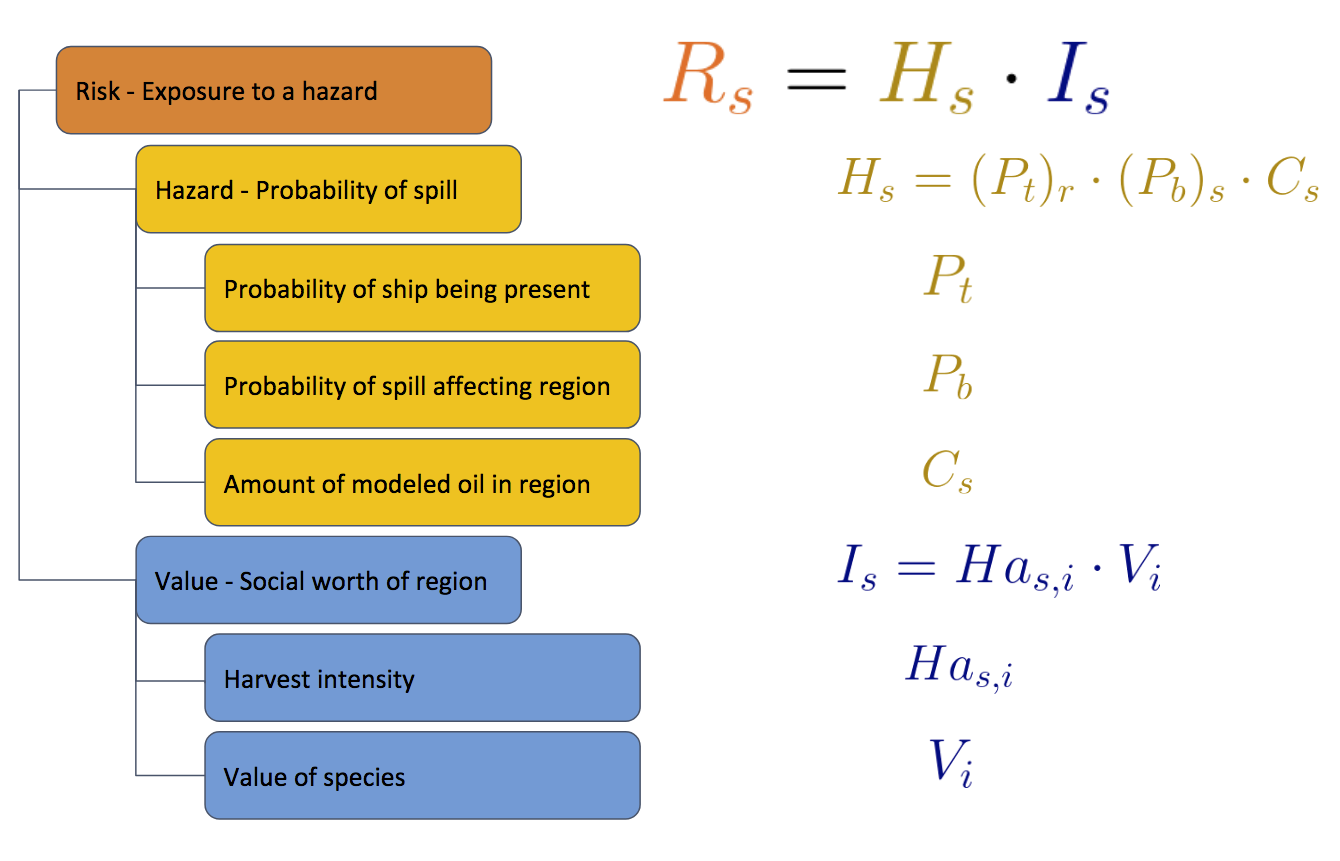
The risk, $R$, to a specific subsistance region $S$ is a combination of the hazard posed to the region from an oil spill, $H$, and the social value attributed to the region derived from subsistence use data, $I$. $$ R_s = H_s \cdot I_s$$
The social value of the area $S$, $I_s$, is combination of the subsistence use data, $Ha_{s,i}$, and the importance of the resource $i$, $V$, to each community. Each resource $i$ was independently weighted by the communities as either low (1/3), medium (2/3), or high (1). $$ I_s = Ha_{s,i} \cdot V_i$$
The hazard score for the region $S$, is a combination of three terms: the probability of a vessel being at location $r$ from the Particle Release Grid, $(P_t)_r$, the probability of an oil spill affecting the subsistence region $S$, $(P_b)_S$, and a concentration index, $C_s$. The concentration index is the mean concentration of oil within the region for each month divided by the maximum mean concentration within the region. $$ H_S = (P_t)_r \cdot (P_b)_s \cdot (C_s) $$
This produces a heat map of the risk $R$ for each region by month, resource, and vessel type.
The results for this analysis were normalized by the maximum monthly risk integrated over a year observed by a single community. This allows for comparison of risk between different months, resources, vessel types, and communities, as well as infering the contribution of each to the total risk.
This project is sponsored and funded by the National Academy of Sciences
For more information please contact Rob Bochenek at Axiom Data Science